Applications fell by a third in July. Approvals didn't.
We track every padel planning application in the UK. Here is what happened last month, and what it says about where the market goes next.
July at a glance
Councils approved more than were submitted
Sixty-nine padel applications were approved across the UK in July, covering at least 175 courts. In the same month just 63 new applications went in, down from 95 in June. Eleven were withdrawn by their applicants.
That is the first month since June 2024 in which councils cleared more padel schemes than arrived. Submissions fell by a third while approvals barely moved, so the queue shortened from both ends at once. Whether that dip is the usual summer lull or the first sign of the market cooling is too early to call. Neither of the two previous Julys behaved this way, though: 2025 was flat on June and 2024 marginally up. August will tell us much more.
Of the 74 applications that reached a decision in July, 69 were approved and 5 refused. That is an approval rate of 93%. If you have been assuming planning risk is what stands between the UK and more courts, the data does not support it. The constraint sits upstream: finding profitable sites and risk capital.
We track application speed council by council. Nationally it takes an average of 119 days from validation to decision, so most of what was lodged this summer will be settled before Christmas.
The Midlands led on approvals, London on ambition
| Region | Approved | Courts approved | New applications | Courts submitted |
|---|---|---|---|---|
| Midlands | 14 | 40 | 8 | 20 |
| East of England | 10 | 17 | 6 | 15 |
| South East | 9 | 25 | 7 | 14 |
| London | 9 | 22 | 7 | 32 |
| North West | 5 | 18 | 4 | 9 |
| Yorkshire | 5 | 12 | 1 | 2 |
| Scotland | 3 | 6 | 1 | 2 |
| Northern Ireland | 3 | 5 | 0 | 0 |
| Wales | 1 | 2 | 1 | 2 |
| South West | 1 | 1 | 4 | 8 |
| North East | 1 | 1 | 1 | 4 |
| Region pending | 8 | 26 | 23 | 65 |
| Total | 69 | 175 | 63 | 173 |
The Midlands approved more courts than anywhere else last month. UK padel started as a London story and it is not one any more.
But look at the last column. London submitted 32 courts across just seven schemes, half as many again as it approved. The schemes going in there are bigger: 4.6 courts per application against 2.5 in the Midlands. London is not leading on volume any more but it is leading on ambition per application, and that will show up in approvals a few months from now.
Twelve courts, eleven of them indoors, in London
The largest padel application anywhere in the UK last month went in on 16 July, on a strip of vacant land in inner London. Twelve courts across two single-storey buildings, eleven of them indoors and one outside, with a cafe and bar, a kitchen, a shop and a gym alongside.
- Submitted
- 16 July 2026
- Status
- Awaiting decision
- Sought
- Temporary permission, five years
- Alongside
- Cafe and bar, kitchen, shop, gym
July's applications that gave a number averaged 3.3 courts, so this is nearly four times the size of a typical submission. In fact, this one scheme is more than a third of everything London submitted in July. Only time will tell whether a scheme that big will be successful, but it is a huge vote of confidence in the London market.
Want to know exactly where this club is?
Padel Genie maps every planning application in the country, filterable by date, decision status and court count. See what is coming before anyone else.
No sign-up required.
Which clubs are actually making money?
Padel Genie also tracks every bookable club in the country to estimate occupancy and revenue. Occupancy across the country averaged 61% in July, and the best-performing club took an estimated £246,000 in padel booking revenue only.
What do the top clubs have in common? Use Padel Genie's X-Ray to view the real occupancy rates and revenues of existing clubs. Compare business models and analyse whether an area is saturated or underserved before spending a penny, or any time, on agents and applications.
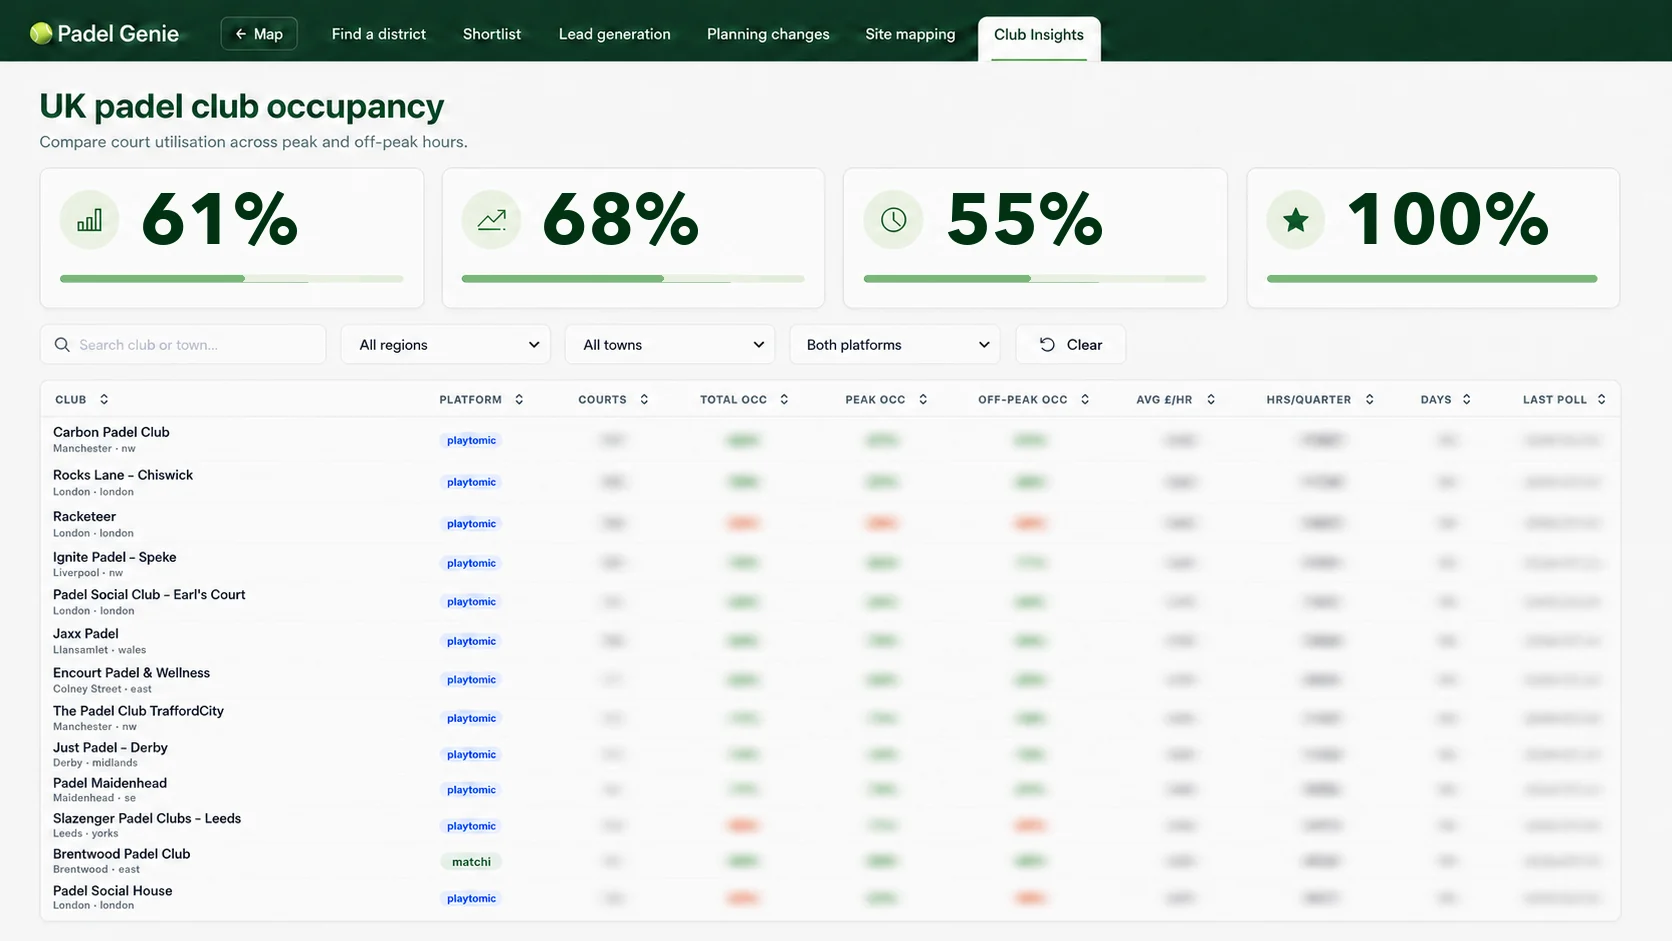
See the real numbers behind every club. Filter by operator, area, occupancy, peak or off-peak, price, or number of courts. X-Ray is included in our Operator tier.
Get startedWhat this means if you are building
Put the numbers together and the picture is clear enough to act on.
Planning is not the risk: 93% of decisions went the applicant's way last month. Demand is not the risk either, with 21 clubs running above 90% occupancy through July.
For operators: as more applications get approved, finding the right site has never been more critical. Operators who pick well will be rewarded; those who pick late will be punished. Find the underserved area first, then find the land inside it that can actually take a scheme.
If you supply the market, the same data works in reverse. Every application above is a potential client. Court builders, architects, and fit-out and technology suppliers who see a scheme at validation are in the conversation months before your competition even knows it exists. Be the first call, not the third quote.
So where should you expand next?
Nobody can hand you a postcode. But there is one number that gets you closest, and it is courts per 100,000 people inside a realistic drive.
Britain has roughly four courts per 100,000 people. That average is close to useless on its own, because it is made of places with twenty and places with none. Which is exactly why it is worth measuring: the gap between a catchment and the national figure is the whole opportunity, and a third of catchments still have no courts at all.
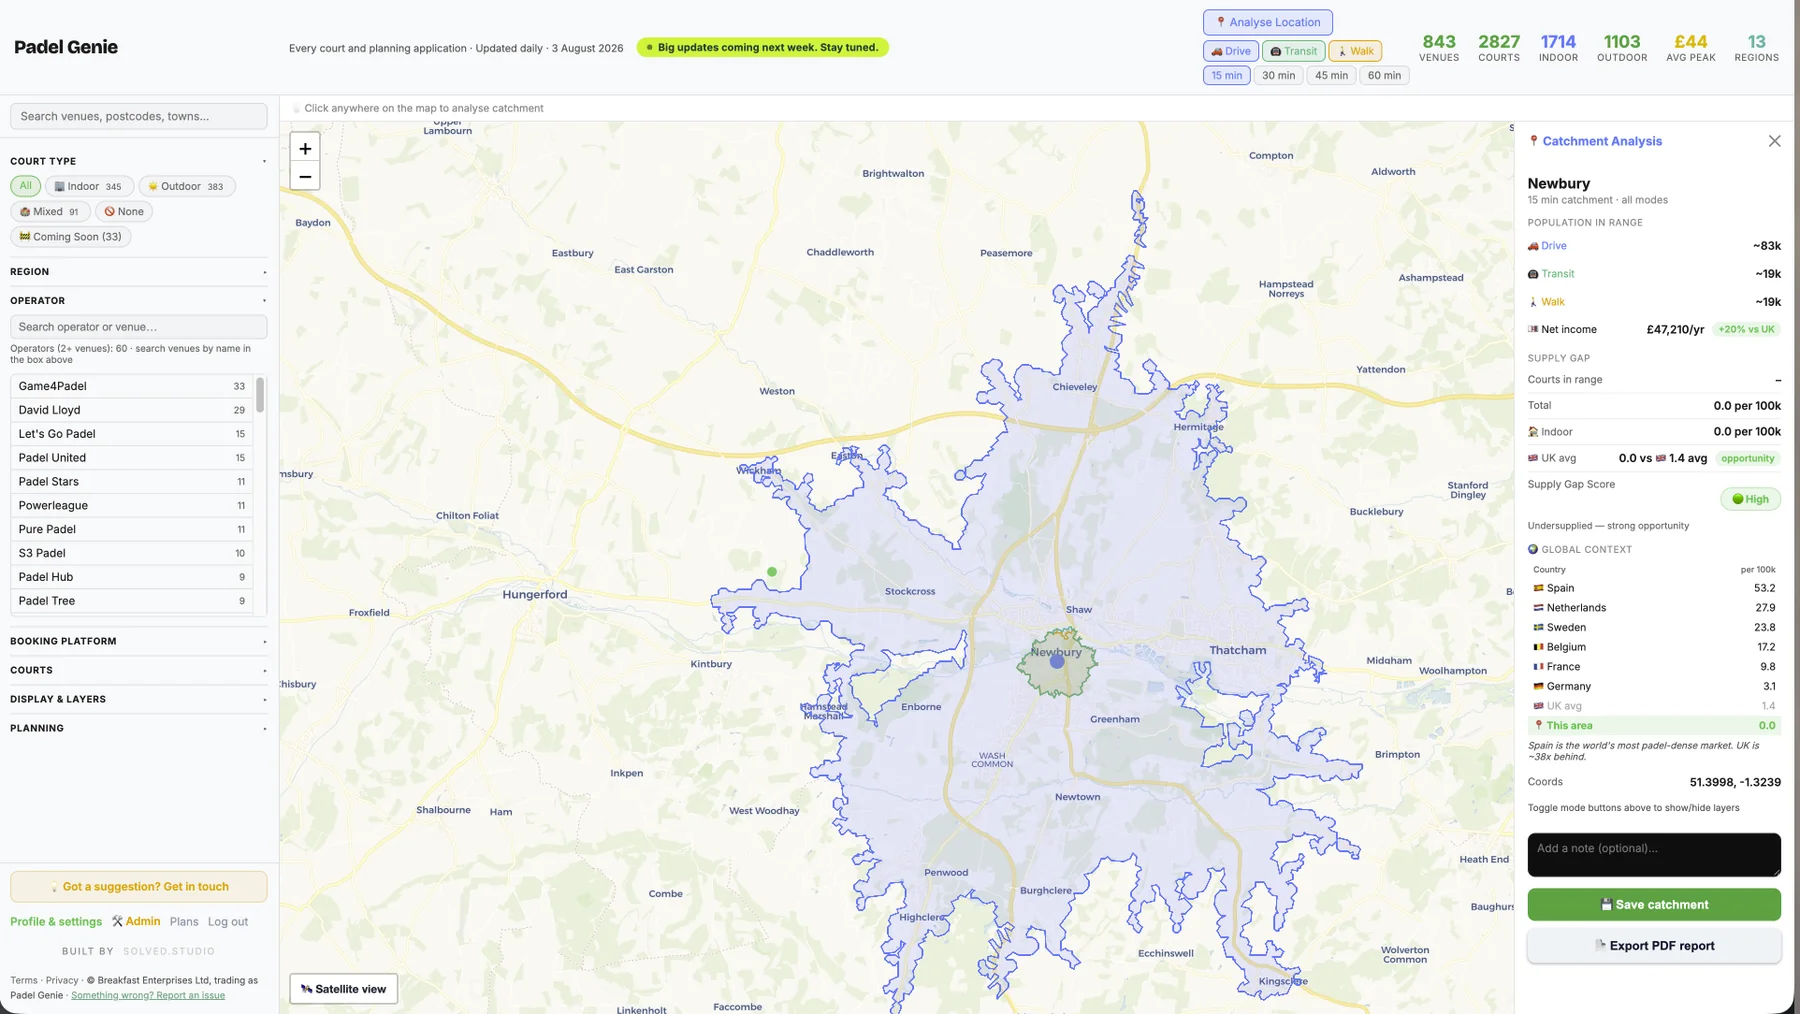
Two things make that number robust. Measure it over a drive time rather than a radius, because ten minutes of traffic decides who actually turns up on a Tuesday night. That is exactly what analyse location does, and you can try it free. And measure the planning pipeline as well as what is built, because a catchment sitting at zero today with nine consented courts is not an opportunity, it is a queue.
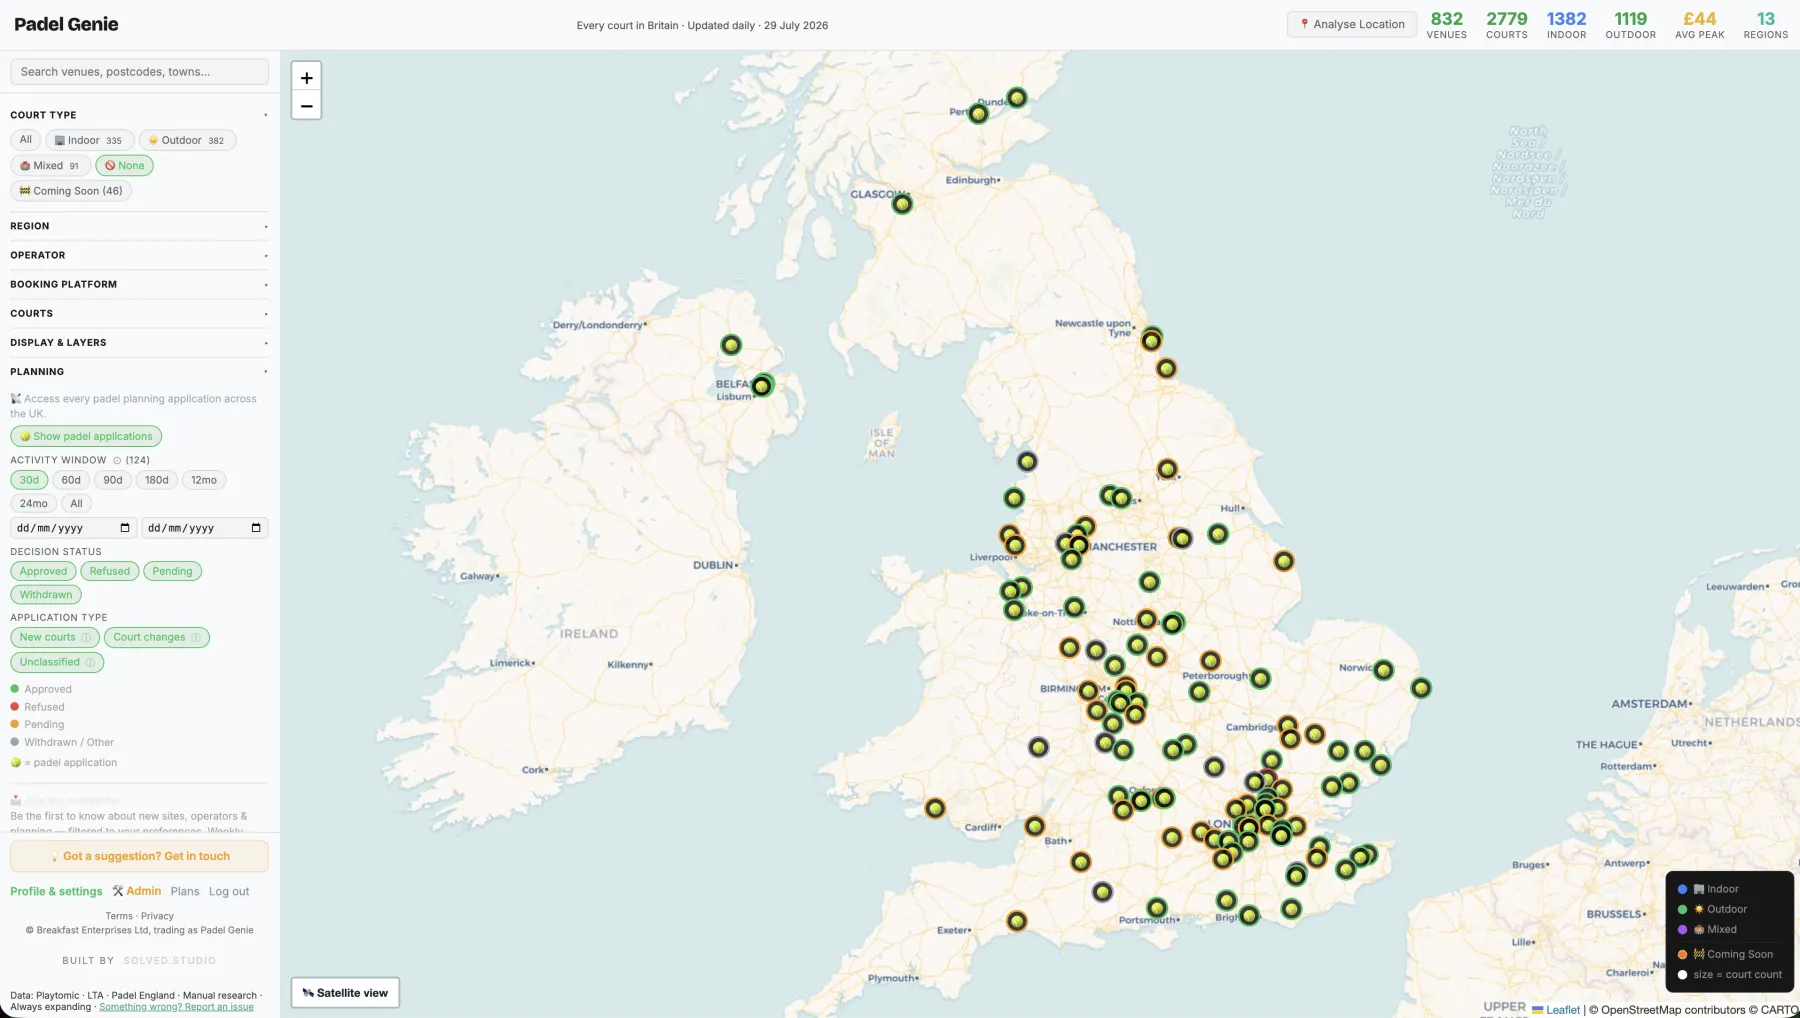
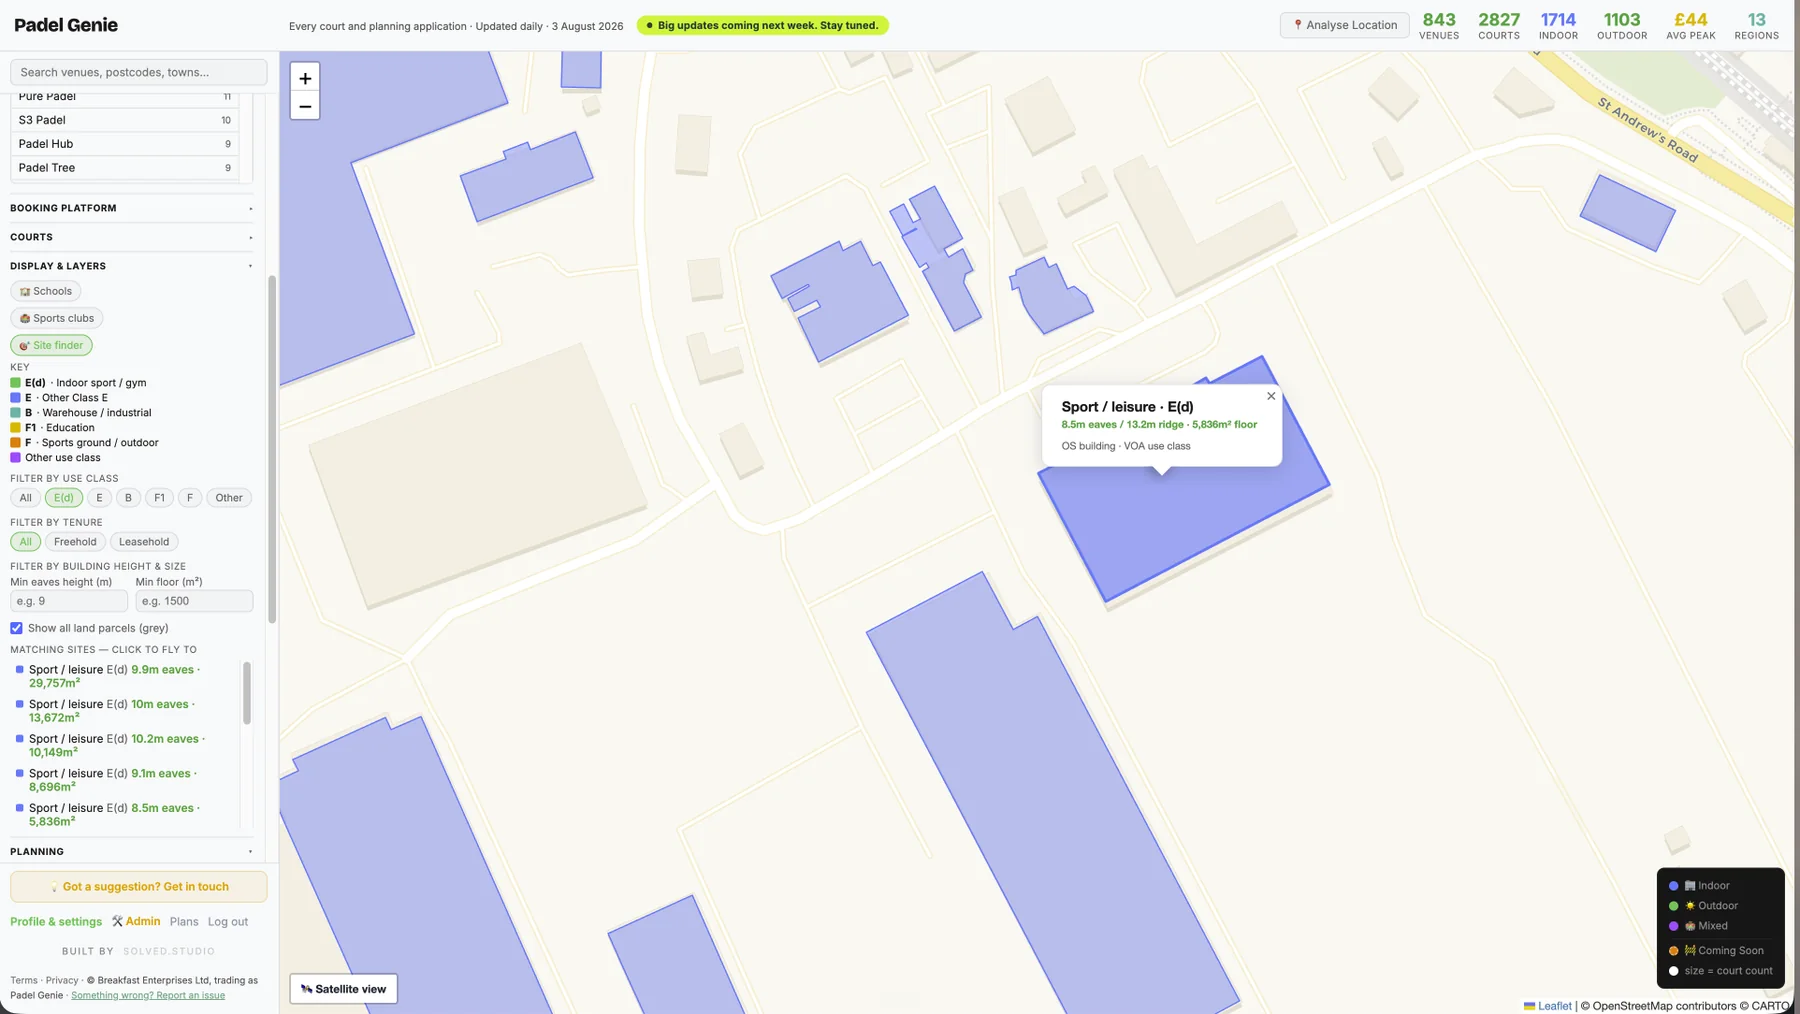
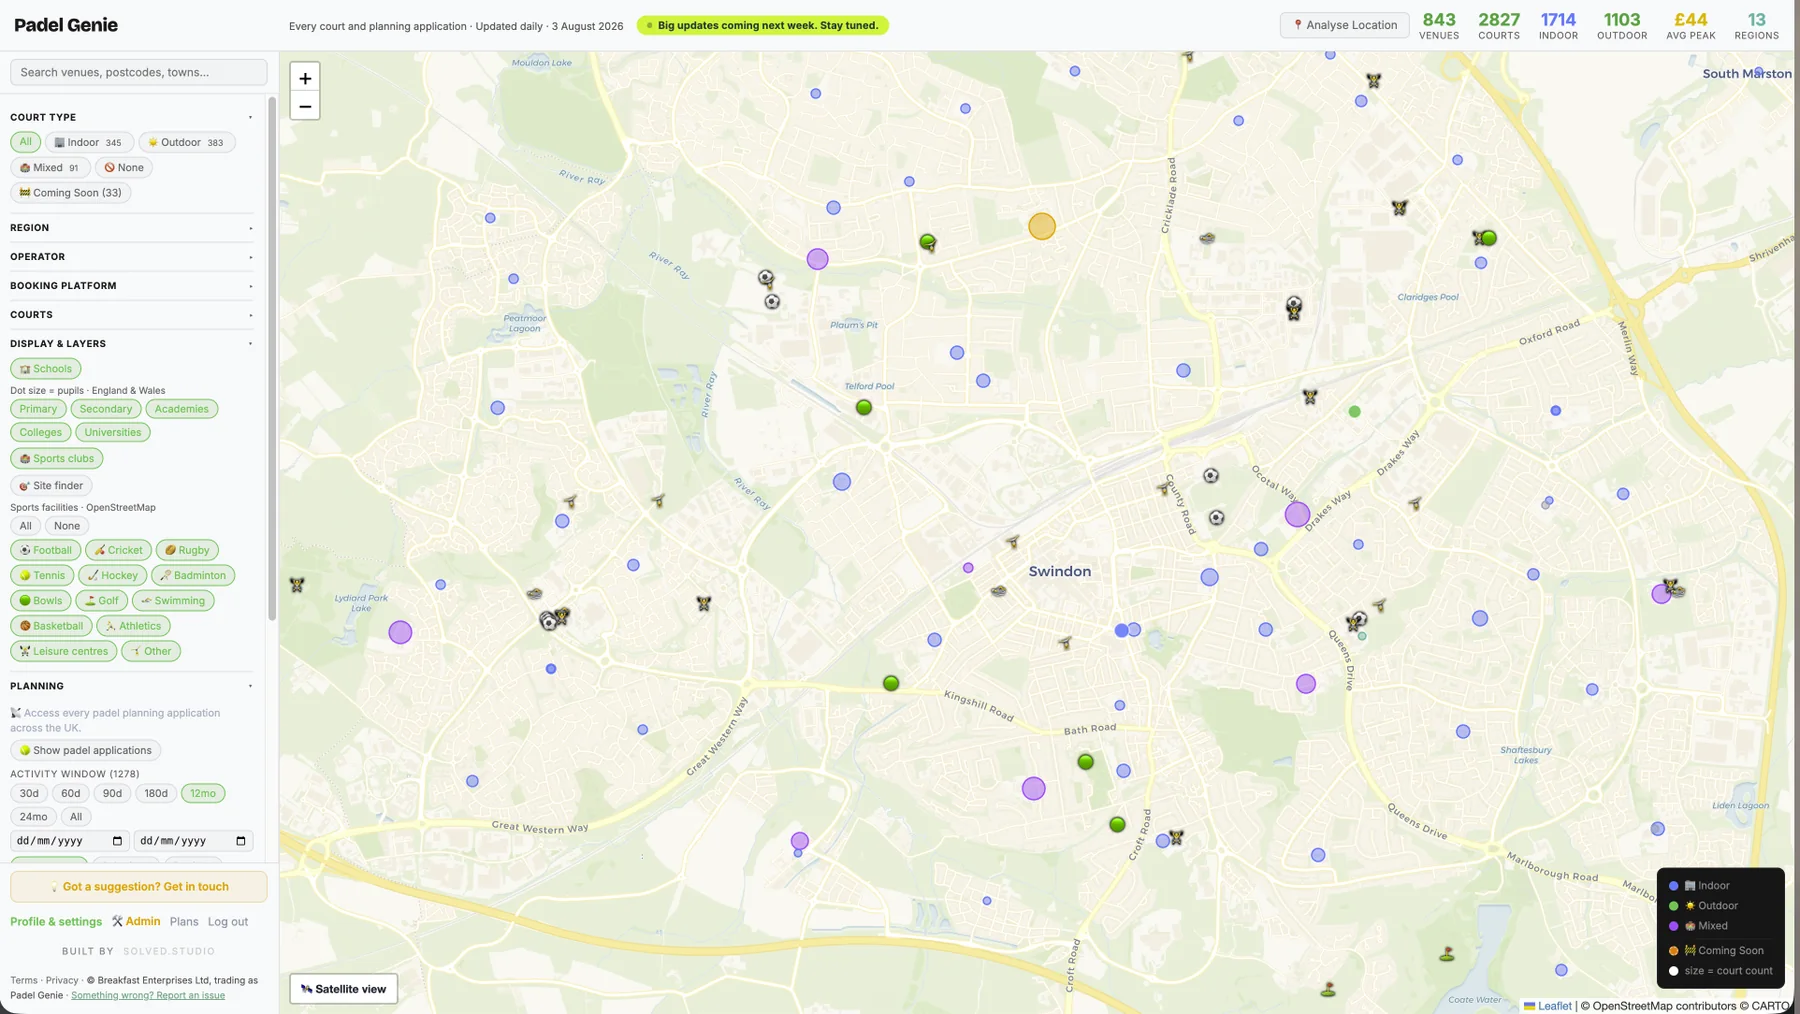
Padel Genie shows you both: what is built, what is consented, and what the gap looks like in the places you are considering. You can then analyse any location, find off-market opportunities, and see how profitable the existing clubs nearby actually are, in a click.

Want to see how Padel Genie could work for you?
Whether you are an operator hunting your next site or a supplier trying to get in front of new clubs, I am happy to talk it through. No hard sell, just a straight conversation about whether this is useful for what you are doing.
Book a call with James →Or get started free and have a look around.
Why we say "at least"
Councils do not publish court counts as a field. The number sits in the wording of each application, and 29% of applicants write "padel courts" without saying how many.
Where no number is given but the application says "padel courts" in the plural, we count two. Two is the smallest figure that can possibly be true, and we would rather understate than flatter the market. The real totals are almost certainly higher than the ones above.
Applications that do state a number average 2.66 courts. If July's 25 unstated approvals matched that, the month's real total would be nearer 192 courts than 175.
Figures are revised as councils publish. A month's numbers are not final on the first of the next one, and we update them as decisions come through.
This is the first of a monthly series
Every recap will go deeper than the last: new trends, different cuts of the data, and the things that only become visible once you have been watching the market for a while.
Got feedback, or something specific you want to see? Let us know. Email me at james@padelgenie.io, or the team at hello@padelgenie.io. We read everything and we are always happy to talk padel.
The State of Padel Report 2026
We will shortly be publishing a full paper on the state of UK padel: growth year on year, the size of the approved-but-unbuilt pipeline, how much of it actually gets built, what occupancy looks like across the country, and which regions are running out of room.
The monthly recap tells you what just happened. This one will tell you where it is all going.
Enjoy this blog?
Glad it helped. Want next month's the morning it publishes?
What would make the next one better? We are always trying to improve.